Stream diagnostics
GlassOut ships with a built-in debug overlay that breaks down exactly where a panel's frame-to-glass latency is spent and what the engine's send queue looks like per client. Turn it on when a panel feels laggy or the picture is unexpectedly soft; turn it back off in normal use.
Turning it on
The overlay lives per-device — each client can opt in independently.
- PC app: Settings → Stream debug overlay.
- Mobile app: gear icon on the Connected screen → Stream debug overlay.
- From a URL: append
?debug=1to any/panel/<id>or/instance/<…>URL.
Once on, every viewer window opened from that device carries the overlay until you turn it off.
Does it cost anything when off?
No. The overlay's per-tick telemetry (panel.debug messages) is
gated server-side on a debug: true flag that the viewer only sends when
the toggle is on. When off:
- The engine doesn't measure or broadcast backpressure telemetry.
- The viewer doesn't instrument decode or paint timing.
- No extra bytes cross the wire.
A tiny time.sync handshake (five samples on connect plus one every
minute) still runs in both states, but its cost is negligible.
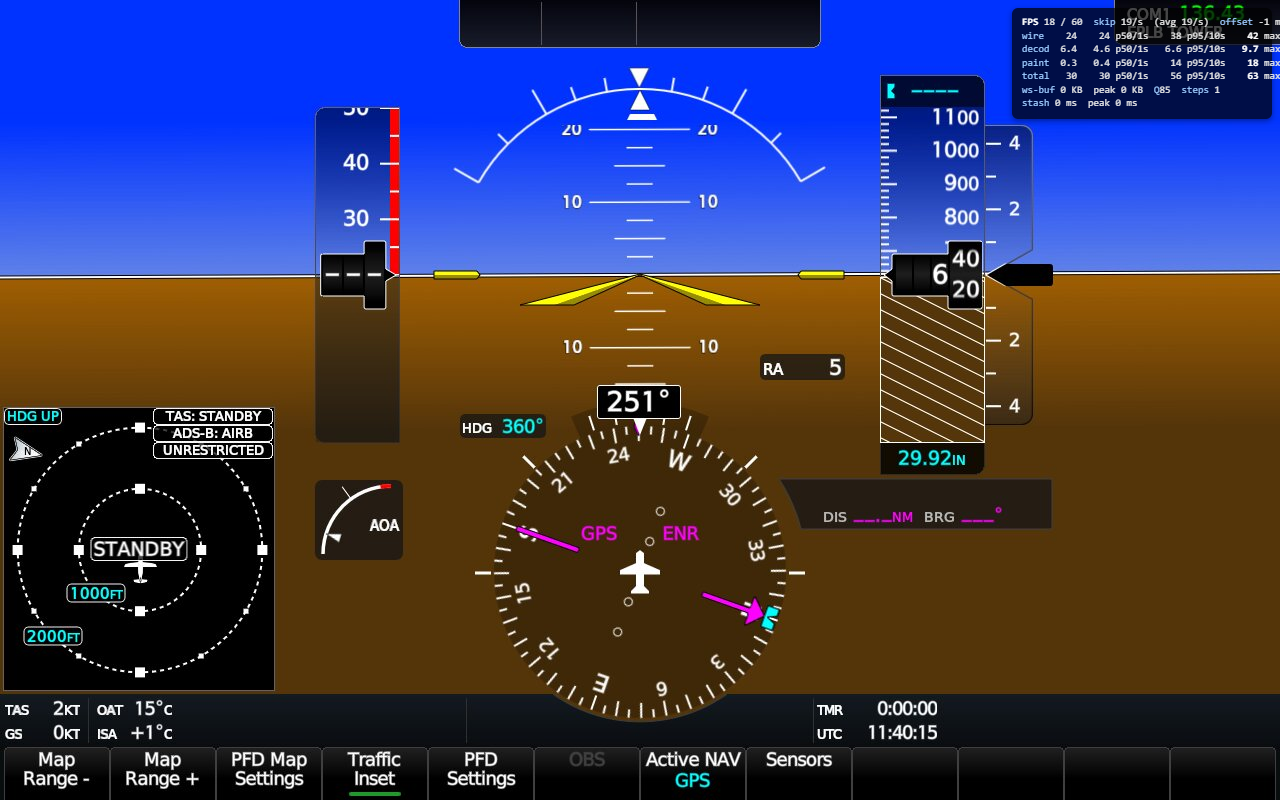
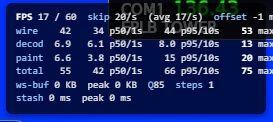
Reading the overlay
The overlay renders as two blocks.
Top block — frame latency
The life of one frame from the engine's Date.now() at tick start all
the way to the painted canvas:
| Label | What it measures |
|---|---|
wire | Engine tick-start → viewer receive. The WiFi / LAN leg. |
decode | Viewer receive → createImageBitmap resolved. CPU/GPU JPEG decode on the device. |
paint | createImageBitmap resolved → drawImage returned. The device GPU compositor. |
total | Tick-start → paint. The figure that actually matters. |
Each label shows rolling p50 and p95 over the last second and the last ten seconds, plus a lifetime max.
Bottom block — server backpressure
How healthy the engine's send buffer looks for this subscriber:
| Label | Meaning |
|---|---|
buffered | Bytes the kernel still has to push over this client's socket. Should stay near zero. |
pending | Age (ms) of the newest frame the engine is holding for you because the socket was full at send time. |
q | JPEG quality bucket (40 / 60 / 75 / 85). Engine moves this up/down per-client based on buffered/pending. |
steps | Total quality transitions since subscribe — flapping hints at a marginal link. |
FPS a/b | Actual frames per second / target frames per second. |
skip N/s | Ticks per second the engine skipped (panel content didn't change or no data from MSFS yet). |
How to diagnose a laggy panel
- Climbing
wirewith stabledecode/paint: the network is the bottleneck. Move closer to the router, switch to 5 GHz, or lower the Frame rate slider. Expectqto drop by itself andstepsto climb. - Climbing
pending+ risingbuffered: the engine is producing frames faster than your socket drains them. The adaptive ladder will stepqdown within ~1 second; if it happens constantly your link just can't sustain the requested rate. - Climbing
paint: this device is the bottleneck — an underpowered tablet or phone in thermal throttle. Lower the Frame rate. FPS 0/60withskip 30/s: the engine is healthy, the panel isn't changing (paused MFD, idle checklist). No action needed.FPS 0/60withskip 0/s: the engine isn't producing frames at all. Check that MSFS is in a flight and the Connection status shows green on the Home tab.
When to leave it on
Don't, in normal flying. The overlay is intentionally ugly — it overlaps the bottom-right of every panel — to remind you it's diagnostic. Toggle it off once you've learned what you need.